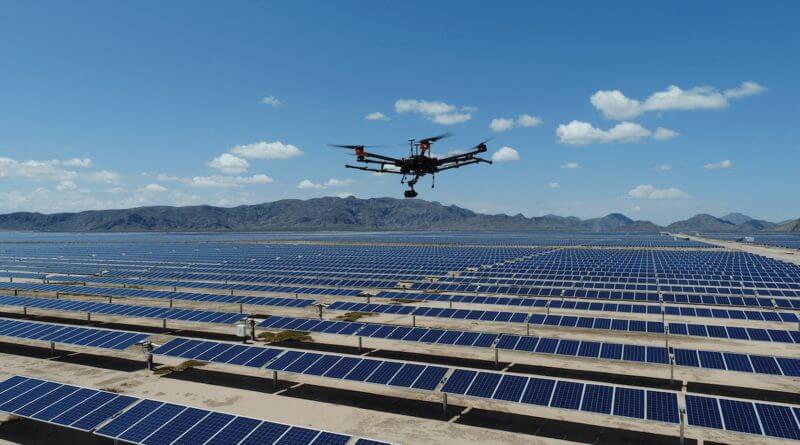
Thermal & RGB Drone Inspection

Solar Plant Survey
& Inspection

Rapid thermal and RGB drone inspections for solar PV plants — detect hotspots, bypass diode failures, soiling, and structural defects across thousands of panels in hours, not weeks.

Solar panel drone inspection
Thermal Hotspot Detection Bypass Diode Failure Soiling Analysis String Fault Detection Shading Analysis Panel Layout Mapping O&M Reporting Thermal Hotspot Detection Bypass Diode Failure Soiling Analysis String Fault Detection Shading Analysis Panel Layout Mapping O&M Reporting
Service Overview

Thermal & RGB Drone
Solar Inspection

Solar PV plants lose 10–25% of their generation capacity due to faults that are invisible to the naked eye — hotspots, diode failures, soiling, and shading. Manual inspection of large plants (10–500 MW) is impractical. Our thermal drone inspection covers the entire plant in hours, producing a geotagged fault map for targeted maintenance.

A 50 MW solar plant with 150,000+ panels can be fully inspected by our thermal drone in 1–2 days — the same job takes a manual team 4–6 weeks. With GPS-tagged anomaly reports, your maintenance team goes directly to the faulty panel.

  • IEC 62446-3 standard compliant inspection
  • Dual thermal + RGB simultaneous capture
  • GPS-tagged anomaly location for each fault
  • String, module, cell level fault classification
  • Soiling index and shading loss analysis
  • Suitable for rooftop, ground-mount & floating solar
RGB Solar
RGB
Thermal Solar
THERMAL

RGB vs Thermal inspection — hotspots invisible to naked eye

What We Detect

Fault Types We Identify

Our thermal + RGB dual-sensor inspection identifies every major fault type affecting solar PV performance — classified by severity and location.
Hotspot (Single Cell)

Cell-level overheating due to partial shading, contamination, or internal defect. Reduces module output and can cause permanent damage.

Bypass Diode Failure

Failed bypass diode causes full string segment to show elevated temperature. Significant energy loss and fire risk if left unaddressed.

String / Module Disconnect

Entire modules or strings showing cold signatures indicating disconnection, open-circuit faults, or wiring failures in the array.

Soiling & Dust Deposition

Uneven soiling detected via RGB analysis — dust, bird droppings, vegetation shadow causing localised shading losses.

PID (Potential Induced Degradation)

Pattern of degradation across module rows detected through characteristic thermal signature — common in large utility-scale plants.

Cracked / Broken Modules

Physical cracks in cells identified via close-range RGB imaging — often from hail, foot traffic, or transport damage during installation.

Shading Analysis

Identification of shading sources — trees, structures, neighbouring rows — causing performance losses at specific times of day.

Tracker / Mounting Misalignment

Panels or tracking systems out of optimal tilt/azimuth alignment — detected via orthomosaic analysis of the entire array layout.

Applications

Solar Plant Types We Serve

From rooftop installations to utility-scale solar parks — our drone inspection adapts to all plant configurations.

Utility-Scale Solar Parks

10 MW to 500+ MW ground-mounted solar parks — complete thermal & RGB inspection with GPS-tagged fault maps and IEC 62446-3 reports for O&M teams.

10–500 MW Ground Mount
Commercial Rooftop Solar

Industrial, commercial, and institutional rooftop systems — rapid drone inspection without scaffolding, roof access risks, or plant shutdown.

Rooftop No Shutdown
Floating Solar (FPV)

Floating PV installations on reservoirs and water bodies where manual inspection is dangerous — drone inspection is the only safe option.

FPV Safe
Pre-commissioning Survey

Full plant inspection before energisation — detect installation defects, mounting misalignment, and panel damage before they go unnoticed for years.

Pre-commissioning QA
Annual O&M Inspection

Scheduled annual or bi-annual inspections for performance benchmarking, insurance compliance, and O&M contractor performance verification.

Annual O&M
Pre-construction Site Survey

Topographic survey and shadow analysis for greenfield solar sites — terrain modelling, shading simulation, and optimal layout planning support.

Site Survey Layout
How It Works

Inspection Process

Best results require optimal conditions — our inspection protocol follows IEC 62446-3 guidelines for solar thermal inspections.
01
Plant Data & Layout Review

We review single-line diagrams, string layouts, plant capacity, and previous inspection reports to plan full coverage flight paths for both sensors.

02
Optimal Conditions Check

Thermal inspections require minimum 500 W/m² irradiance and near-full plant output. We schedule flights between 10 AM – 3 PM under clear-sky conditions.

03
Dual-Sensor UAV Flight

Automated flight with simultaneous thermal (FLIR/DJI Zenmuse) and RGB camera captures every module from optimal altitude for resolution and coverage.

04
Thermal Image Processing

Thermal and RGB datasets are processed and co-registered. AI-assisted hotspot detection algorithms flag anomalies across the entire dataset automatically.

05
Fault Classification & GPS Tagging

Each detected anomaly is classified by fault type and severity, geotagged with precise coordinates, and referenced to string/inverter ID for O&M use.

06
IEC-Compliant Report Delivery

Complete inspection report with fault summary, thermal images, GPS coordinates, severity ranking, and maintenance priority list — delivered within 48 hours.

What You Get

Inspection Deliverables

Thermal Report

IEC 62446-3 compliant thermal inspection report

Fault Location Map

GPS-tagged anomaly map overlaid on plant layout

Orthomosaic RGB

High-res RGB orthomosaic of entire plant

Fault Priority List

Severity-ranked maintenance action list

Performance Analysis

Estimated generation loss per fault type

O&M Report

Full operations & maintenance report

Technical Specs

Equipment & Accuracy

UAV Platform: Multi-rotor with dual-sensor payload
Thermal Camera: FLIR / DJI Zenmuse H20T, 640×512 IR
RGB Camera: 20MP high-resolution visual camera
Thermal Sensitivity: ±0.5°C NETD
Coverage: 500–1,000+ panels per hour
Optimal Conditions: >500 W/m² irradiance, clear sky
Report Formats: PDF, XLSX, KMZ, GeoTIFF, TIFF (thermal)
Standard: IEC 62446-3, IEA PVPS Task 13
Frequently Asked

Solar Inspection FAQs

Do panels need to be powered on during inspection?
Yes. Thermal inspection requires the plant to be operating at full capacity during the flight. Panels must be generating current to show temperature differentials that indicate faults — typically at least 500 W/m² solar irradiance.
How many panels can you inspect per day?
Depending on plant configuration and flight altitude, we can inspect 50,000–200,000 panels per day. A 10 MW plant (~30,000 panels) is typically completed in 2–3 hours of flight time.
What accuracy can you locate a faulty panel to?
Each faulty panel is geotagged to within 10–30 cm GPS accuracy. Our reports include thermal image, location coordinates, string ID, and row/column reference so your team can locate each fault within minutes.
Can you inspect rooftop solar without shutting down operations?
Yes. Drone inspection requires no access to the roof, no scaffolding, and no plant shutdown. We operate from ground level, making it completely non-invasive for operating facilities.
How often should solar plants be inspected?
Industry best practice recommends annual inspection for utility-scale plants, with post-monsoon inspection being especially valuable after dust, rain, and potential storm damage. We offer service contracts with regular scheduled inspections.
Book Your Inspection

Find Hidden Faults in
Your Solar Plant

Share your plant capacity and location — get a custom inspection quote within 24 hours. IEC-compliant reports, nationwide service.